
How Do I Read a DXA Bone Density Report?
Posted by: Men's Health Boston in Men's Health on April 30, 2024
When it comes to health and well-being, it’s easy to wax poetic about the virtues of long-term thinking. But there is a big difference between knowing something is important and doing something about it. Just ask any retirement planner.
At Men’s Health Boston, we prefer to emphasize problem prevention with our patients. And the unfortunate reality is that, as you age, having low bone strength can be absolutely devastating.
One 2017 study revealed that in people aged 60 and older, the risk of dying (i.e. all cause mortality) nearly tripled for the first year following a hip fracture, and though it dropped from there, it remained elevated for years afterward. Not to mention the life constraints and disability that come with healing from a fracture.
How do you measure bone health?
Dual Energy X-Ray Absorptiometry (often abbreviated as DXA or DEXA) is a scanning device which makes use of x-ray beams to assess different body tissues such as bone, muscle, and body fat. It produces a report which your doctor can use to anticipate issues with weak bones, assess muscle health and balance, and analyze your risk of metabolic diseases associated with pesky visceral fat. Not bad from a scan that takes about 10 minutes and exposes you to the same amount of radiation you get by simply living at sea level for a day.
When it comes to objective measurements of bone and body mass, DXA is considered the “gold-standard”, and it’s used in research labs all over the world.
Who should get a DXA Bone Density Scan?
Unlike other body tissues, bones reach their peak strength during our young adult years between the ages of 20-29 years old. We then spend the rest of our lives largely trying to hang onto what we have for as long as possible. This is a major issue when you consider how many different things can accelerate bone loss, including:
- Smoking, drinking alcohol, poor diet, and low physical activity
- Vitamin D deficiency, a widespread problem in New England
- Hormone issues such as low testosterone, menopause, or prostate cancer therapy
- Medical conditions like rheumatoid arthritis, kidney disease, and celiac disease, among others
- Long-term use of medications such as steroids, asthma inhalers, and heartburn relievers
- Genetics – in particular, having close family members diagnosed with osteoporosis
Any one or more of the risk factors above can silently wear down bone tissue for years before anyone detects it. That’s why we take a more aggressive approach toward baseline DXA bone scans in all of our low testosterone and postmenopausal patients at Men’s Health Boston. This is often done well in advance of the typical advice to screen women at age 65 and men at age 70.
What can I do if I have weak bones?
The first step is always identifying the issue. DXA scans allow us to get an intimate picture of your skeletal health, and whether there are particular regions at risk for fracture. The good news is that there is a lot we can do to improve bone strength and lower risk, especially when problems are identified early.
Common interventions include supplementing with calcium and vitamin D, focusing on weight lifting exercises, and utilizing medications which help bone tissue to rebuild itself. Doing repeat scans over time allows us to understand if the treatment plan is working, and adjust if necessary.
But diving into how we deal with low bone density at MHB isn’t the goal of today’s post. First, we want to provide a resource that we have struggled to find anywhere else: a one-stop-shop guide for how to read a DXA Bone Density Report.
And the best way for us to do that is to show you a real report from a real patient, so that what you see here will match the graphs and pictures from your own report if you have the scan done in our office.
Please note: what follows below is a very technical description of how to read and interpret a bone density report. It is designed to be useful to our patients who have already had a DXA scan done, and who want to better understand their report. We advise all patients to review their scans with their medical providers, so that they can be an active and informed participant in developing a treatment plan tailored to their needs.
If you have not ever had a DXA scan done but are interested in getting one, contact our office for pricing options. In many cases, insurance will cover Bone Density scans for those at-risk of low bone mass.
And if you choose to keep reading past this point, be ready to get into the weeds.
____________________________________________
How do you read a Bone Density report?
The figures that follow are taken from a scan of a mid-30’s caucasian male patient. Depending on your age, gender, and ethnicity, there may be some variations in your individual report. Most noticeable is that you won’t see a value noted under “T-score” in our example, because T-scores are not reported for men under the age of 50. But we’ll explain more on that later.
Part 1: Whole Body vs. Regional Site Analysis
A DXA scan for bone density will take a full skeleton bone mineral density (BMD) assessment, aka “Whole Body”, as well as honing in on three specific skeletal sites that are particularly vulnerable to fractures:
- The lumbar spine, traditionally encompassing the L1 – L4 vertebrae at the base of the back.
- The femoral neck, the bridge of bone just below where your leg bone (femur) attaches to your torso.
- The total hip, a composite measurement of 3 distinct areas of bone at the top of the femur.
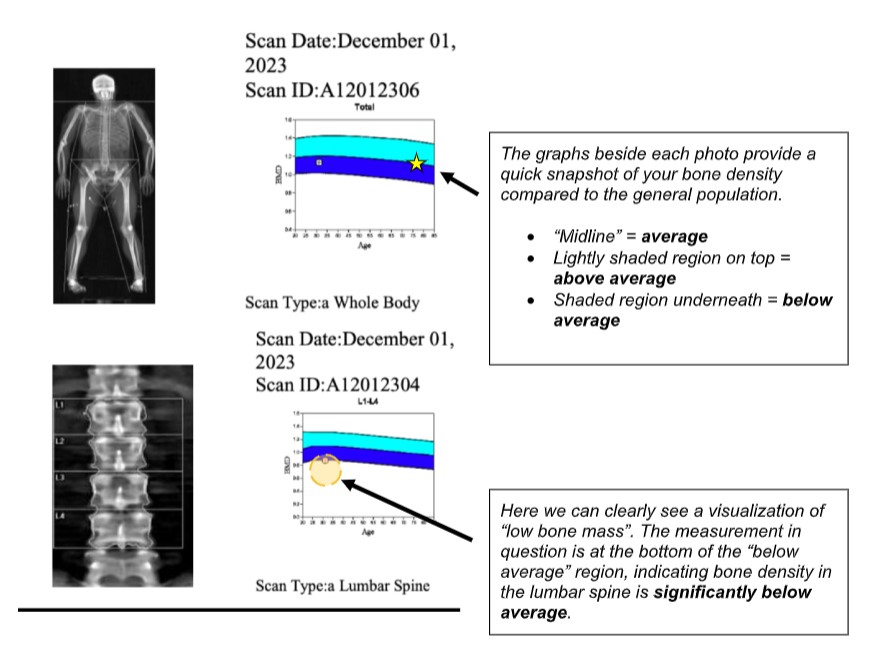
The graphs above provide a quick snapshot of where your bone density stacks up among the normal distribution of people your age. However, there is a lot of variation within the general population, so scoring “below average” is not necessarily concerning. Instead, determining fracture risk relies on statistical analysis, represented as a “T-Score” and “Z-Score”.
Part 2: Interpreting T-score vs. Z-score
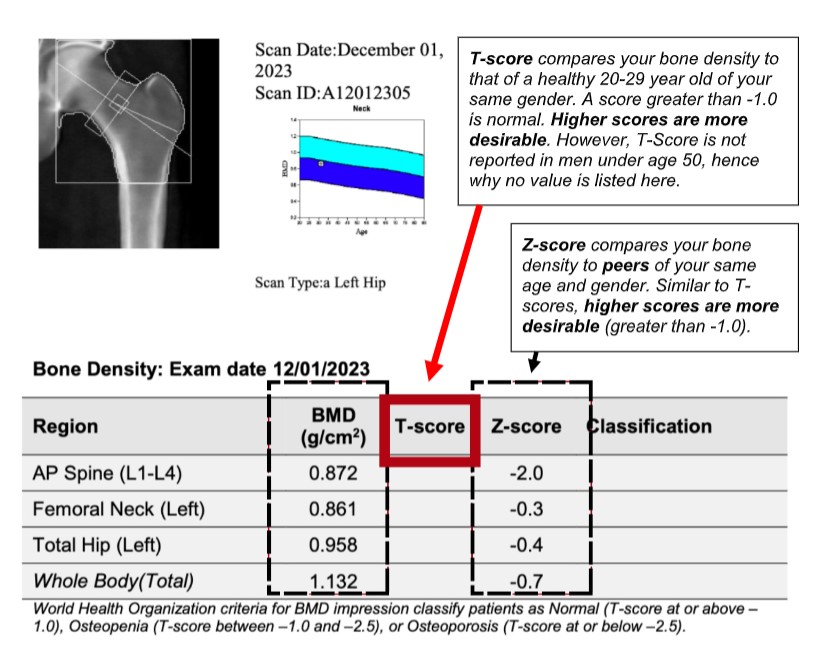
Below the bone scan images, your report will display a table like the one above, though you might have slightly more information listed than you see here. In the first column, you can see all three regions discussed and pictured above, as well as the whole body bone mineral density, scored in grams per centimeter squared (if it’s been a while since you took high school chemistry, remember that density describes how much mass is packed into a given space). The next column is a value known as a T-score.
T-Score (aka “Young Normal” or YN)
A T-score is a statistical comparison of how you measure up to the average bone density of a normal, healthy young adult (aged 20-29) of your same gender at a given skeletal site. This “average” is determined based on a database of real DXA scans collected by the National Center for Health Statistics from 1999-2004.
It might seem odd to compare your bones to those of a young adult potentially half your age, but remember that peak bone mass is achieved during your 20’s. By comparing your current bone density to what is likely your “lifetime peak bone mass”, we can get a good sense of how quickly you are losing bone mass, and determine your relative risk of fracture as you age.
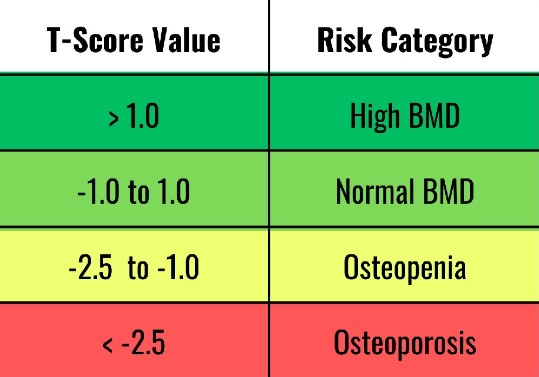
T-Score is reported as a 2-digit decimal, with “0.0” representing an average bone density in the general population. A positive T-score indicates you have particularly strong bones, while a negative score reflects some degree of lower bone mass. Because there is a lot of variation as to what constitutes “normal”, we use T-scores to group people into risk categories for bone fracture.
T-score is used to diagnose osteopenia (noticeably weakened bones) and osteoporosis (brittle bones at heightened risk for fracture), which will be noted in the “classification” column at the end of the table above if relevant to you. One confounding factor often brought up in the discussion around the use of T-Scores is that the amassed reference data is strongest specifically in post-menopausal Caucasian women in the United States. This group has been the focus of the most bone health research over the past 3 decades.
However, it’s known that “normal bone mass” varies country to country and ethnicity to ethnicity, making it a challenge to standardize everyone. Despite this, many experts contend that what matters most for determining fracture risk is the absolute value of the bone mineral density (BMD) at a given site, which informs why the World Health Organization (WHO) and the International Osteoporosis Foundation (IOF) both still recommend defining the cutoffs for osteopenia and osteoporosis on the basis of the NHANES Female reference data, regardless of a patient’s gender or ethnicity.
In our example above, you’ll notice that both the “T-Score” and “Classifications” columns are blank. This is normal for a male patient under the age of 50. While women see bone loss begin to drop in their 40’s, most men will have relatively stable bone mass between the ages of 30 and 50 (unless there is an underlying issue that accelerates bone loss). So, T-score is not very useful in this group. However, we can still get a sense of long-term fracture risk in these patients by looking at the Z-score, which we will address further below.
Z-Score (aka “Age Matched” or AM)
While the statistical basis is similar, a Z-score differs in that it compares your bone mass to age-and-gender-matched peers, rather than to the “young normal” population. This helps to give us a sense of where you fall on the normal distribution of people in your same life stage, and is particularly useful in the absence of a T-score (such as in our example).
The final summary table on the report displays an Age-matched % (AM) column. This represents your “percent of expected bone mass at your current age” based on statistical modeling using Z-score data. Here, anything below 100% is “below expected average bone mass” amongst your peers. However, similar to T-scores, there is a lot of variation in what is considered normal. So, Z-score is not particularly concerning until it approaches -2.0 or lower. The earlier we catch this, the better we can address the long-term risk.
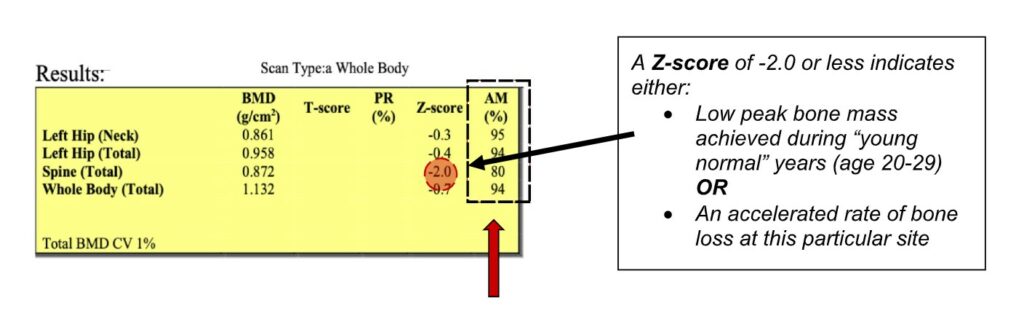
Here’s the big takeaway: if either your T-score or Z-score at any given bone site comes back at -2.0 or lower, the important question to ask is why? Did you accrue a lower peak bone mass during your childhood and young adult years, and your overall peak point is lower than average? Or is there an underlying issue causing you to lose bone tissue at an accelerated rate? Identifying underlying risk factors will play a major role in addressing bone loss prevention over your next several decades.
Bonus: Understanding your Trabecular Bone Score (TBS)
Over the years, advances in DXA technology have allowed for deeper analysis of bone fracture risk based on the state of the microarchitecture of the bone tissue itself, known as a Trabecular Bone Score (TBS). This measurement looks specifically at how bone tissue in the lumbar spine is structured, rather than just the regional density. It helps inform what is already noted on the DXA scan. A standard TBS report will produce a 4-digit score, alongside a regional heat map of spinal microarchitecture and a graph representing your personal ranking amongst the general population, as shown below.
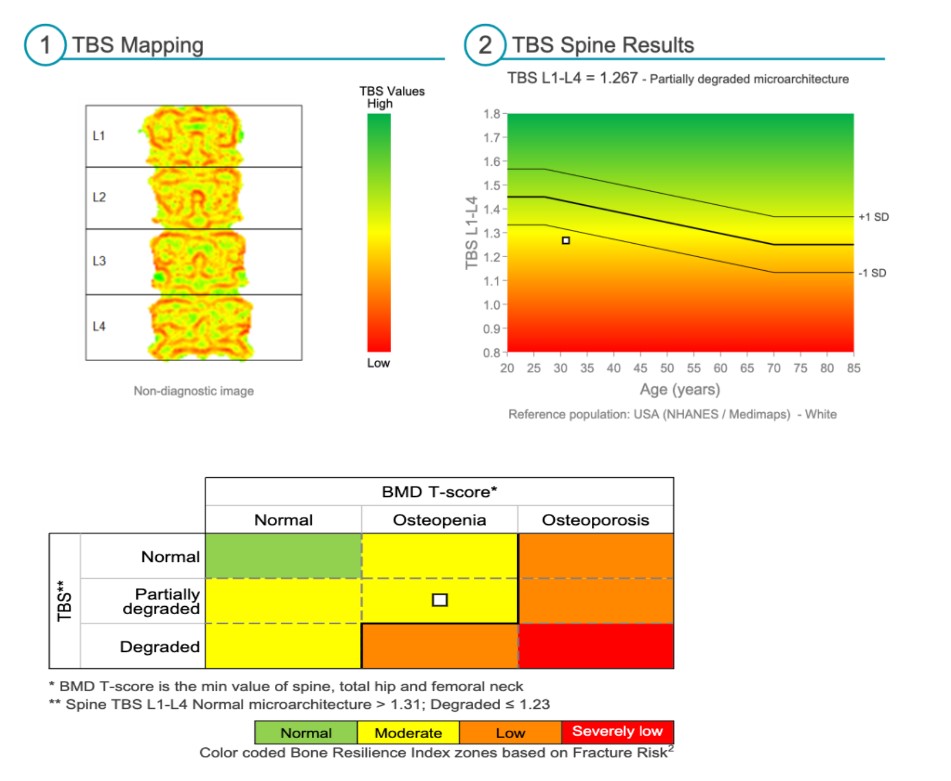
If your TBS score is low, it can point to structural weakness in the bone that a DXA scan on its own might miss. TBS is still an area of emerging research; however, there are cases where broken bones occur in people with “normal” bone density as measured by DXA – and TBS allows us to address testing limitations which can miss-categorize a subset of patients with reduced structural integrity, but normal bone density.
In Conclusion…
DXA scans provide a treasure trove of objective information, especially in the hands of the right interpreter. The first step is always to establish your current baseline, so that you can monitor any changes (good or bad) over time. If your scan uncovers low bone density, basic interventions such as weight-bearing exercise, supplementing vitamin D and calcium, and addressing hormonal deficiencies can be highly impactful.
However, these interventions are best tailored to your personal needs – taking into your account diet and lifestyle, cardiovascular health risk factors, and any underlying factors causing poor bone health. We’ll address more on this topic in an upcoming blog post where we’ll discuss how to reduce risk of bone fracture.
If you’re interested in bone density analysis, or you’ve had a scan but aren’t sure how to reach your health goals, we’re here to help. For more information on our industry-leading care at MHB, click here. For a clinical evaluation, call our office or request an appointment with one of our expert practitioners today.